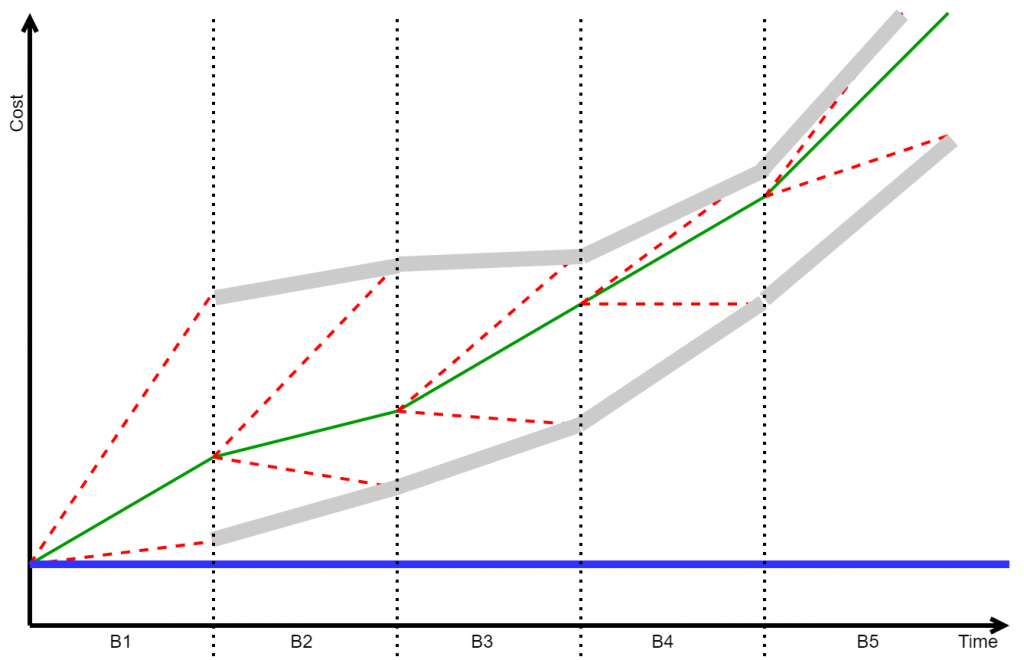
Figures 1 and 2 show cost versus time; Figure 1 shows long iterations, Figure 2 short iterations. We choose to do something at time zero, at the origin of the graph in the Figure, and when we do so, we do it under some assumptions that we made at that time. Dashed red lines convey the uncertainty we have, in that we expect actual cost to be anywhere between these dashed lines. The more uncertainty, the more these dashed lines should diverge from the green line; this simply reflects the idea that we start doing something, as time passes this costs, the cost accumulates, but just how quickly depends on many factors we do not necessarily understand well. The more such unknown knowns, the wider the dashed area. Still in Figure 1, we keep doing something until the end of the iteration, that is, the dotted vertical line, at which we show what we are doing to customers of that thing, and they can give feedback that helps us navigate uncertainty after that dashed line. Notice the wide grey lines: they suggest how, after we got feedback, we are less uncertain about how cost will accumulate afterwards, which is what explains why these grey lines are shown to converge. The reason the green line does not start in the origin of the Figure, is that getting feedback has a cost, and lifts the entire cost forecast up.
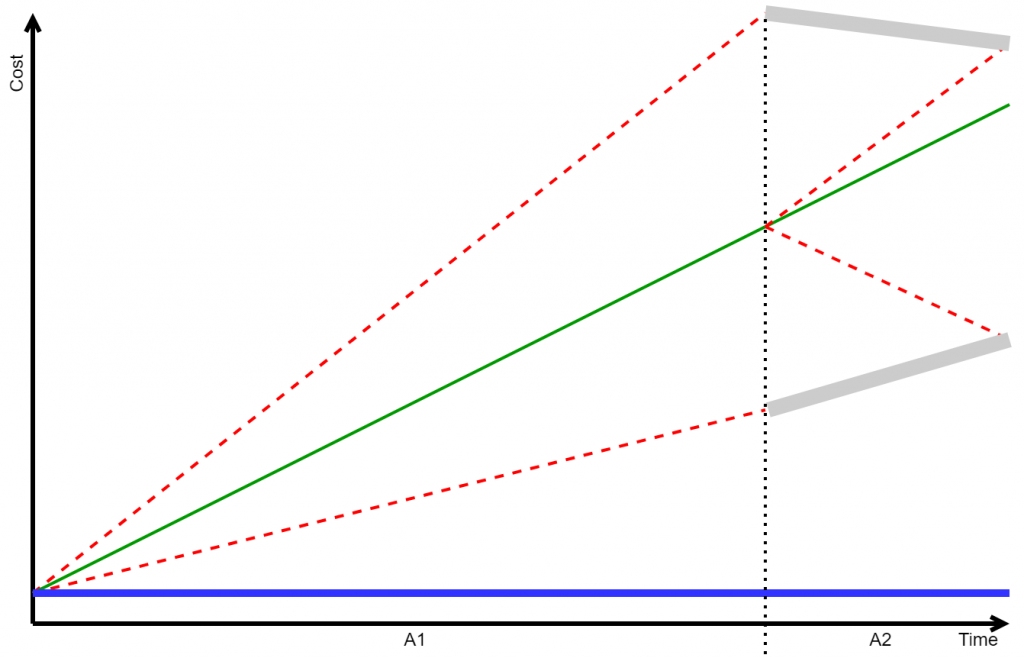
Figure 2 shows what should happen when we shorten iterations, that is, we go more frequently to get feedback to check if we are on the right track. This increases the cost of getting feedback, since we now need to do it more frequently. However, at the end of each iteration, as the grey wide lines are showing, uncertainty should reduce relative to the previous iteration. This requires that we still are trying to solve the same problem from one iteration to the next, instead of changing completely what is being made, in which case these dashed lines would keep widening, regardless of how frequently we solicit feedback.
Figure 2 conveys the idea that if you are unsure, ask, and do it quickly and frequently. If you do so, a problem to focus on is to identify the right people to ask feedback from. Otherwise, you are only paying more (the blue line) for more garbage, more frequently.